What Is It?
Nagios passive agent is a cross platform monitoring agent for the popular Nagios monitoring tool. It aims to fill in some of the gaps not filled by other methods of running checks on monitored servers, most notably where the checks are running on a remote server which is only able to communicate back to the Nagios server over firewalls/proxies and HTTP/S.
What Does It Do?
- Open source and free to use however you see fit (licensed under the GPL v3)
- Simple scheduling (run a check every so many seconds)
- Support for existing Nagios checks and performance information
- Submission of passive checks results using the Nagios CGI interface
- HTTP Proxy Support
- Cross-platform - tested on Linux, Windows and Solaris. Written in Java/Groovy so most platforms can be supported.
- Simple queuing to allow resubmition in the event of temporary network outages.
- Serveral built in OS checks (CPU, Disk)
- Built in HTTP response checks
- Serveral built in Oracle checks (Tablespace free, Buffer Cache Hit Ratio. Custom SQL)
- Extensible API to add in custom check plugins
- Further SQL Server and Oracle built in checks
- Further submission options other than the Nagios CGI interface
- More complex performance gathering features as required
- Simple groovy script plugin mechanism to make writing checks using the NPA API quite simple
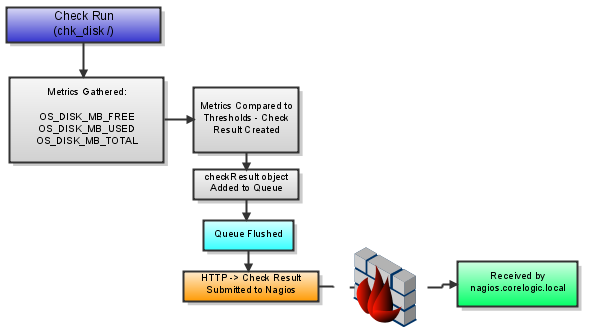
Here is an explanation diagram of how check results are returned to Nagios over firewalls and the internet:

You will need a publically accessible HTTP server for Nagios to allow check results to be returned this way. It can use basic HTTP authentication to prevent unauthorised access. It's also recommended that you set up HTTPS for this server so that none of the traffic between your monitored servers and the Nagios server can be intercepted.